



Sean Barton
Chief Operating Officer
Questions about your own room?
One short call to walk through the room, the goals, and what is possible. No pressure, no obligation.
The number that has not moved
Start with the scale. The National School Lunch Program served about 30 million students a day across more than 95,000 schools in FY2025, which works out to roughly 4.9 billion lunches in a year. Breakfast reached about 16 million students a day.
Lunches served daily, FY2025
SNA
Of enrolled students took lunch, FY2023
CRS R48515
Of programs report food cost challenges
SNA, SY2025-26
Are seriously concerned about 3 year sustainability
SNA, SY2025-26
Now the part that should bother us. Within schools that operate the program, participation peaked at 63% of enrolled students in FY2010 and has hovered around 57% to 59% ever since.
What students say when you ask them
Researchers ran eight focus groups with 64 students aged 14 to 19 across three high schools in South Los Angeles. The barrier identified at all three schools was the length of the line.
“Long cafeteria lines” was identified across all three schools as a key barrier inhibiting access and intake of school lunch meals.
A queue that takes eleven minutes is not a recipe problem. It is a geometry problem, and geometry can be redrawn.
An honest word on what design can and cannot do
Start with the scale. The National School Lunch Program served about 30 million students a day across more than 95,000 schools in FY2025, which works out to roughly 4.9 billion lunches in a year. Breakfast reached about 16 million students a day.
Now the part that should bother us. Within schools that operate the program, participation peaked at 63% of enrolled students in FY2010 and has hovered around 57% to 59% ever since.
FAQ
Start with the scale. The National School Lunch Program served about 30 million students a day across more than 95,000 schools in FY2025, which works out to roughly 4.9 billion lunches in a year. Breakfast reached about 16 million students a day.
Make the menu readable from the back of the line
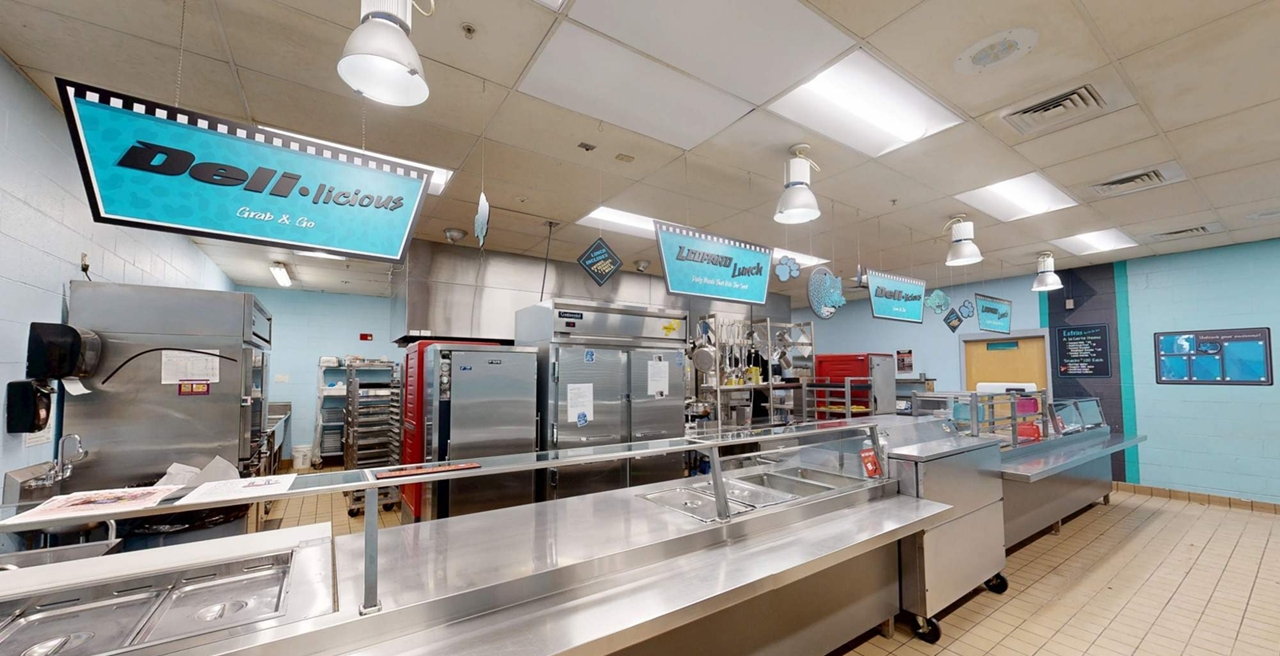
Most menu communication is posted where the decision has already been made. Put it where students are standing with nothing to do, in type that reads at twenty feet, and you convert queue time into decision time. That is the cheapest minute you will ever get back.
Make the menu readable from the back of the line
Most menu communication is posted where the decision has already been made. Put it where students are standing with nothing to do, in type that reads at twenty feet, and you convert queue time into decision time. That is the cheapest minute you will ever get back.
Make the menu readable from the back of the line
Most menu communication is posted where the decision has already been made. Put it where students are standing with nothing to do, in type that reads at twenty feet, and you convert queue time into decision time. That is the cheapest minute you will ever get back.
Make the menu readable from the back of the line
Most menu communication is posted where the decision has already been made. Put it where students are standing with nothing to do, in type that reads at twenty feet, and you convert queue time into decision time. That is the cheapest minute you will ever get back.
Now the part that should bother us. Within schools that operate the program, participation peaked at 63% of enrolled students in FY2010 and has hovered around 57% to 59% ever since.